Measure the work that improves
Connect agent activity to accepted business outcomes, establish a credible comparison, and distinguish useful capacity from realized financial value before deciding whether to scale.
PDF EDITION
Take the whitepaper into your next review.
Save a copy to read offline or share with your team.
Abstract
Connect agent activity to accepted business outcomes, establish a credible comparison, and distinguish useful capacity from realized financial value before deciding whether to scale. All financial arithmetic and operating quantities in the worked example are hypothetical. They demonstrate a measurement method and are not forecasts, client results or investment advice.
Activity is not the unit of value
An agent can produce more drafts, invoke more tools and handle more conversations without improving the business process it serves. The relevant question is what happens to accepted work: its quality, total human effort, completion time, cost and consequences. Counting activity is useful for understanding usage, but it is a weak basis for an investment decision on its own.
This paper proposes an outcome ledger for agent-enabled work. The ledger follows a defined task from eligibility through use, completion, acceptance, rework and downstream effect. It pairs operational measures with a comparison design and a clear financial interpretation. The aim is to decide whether to continue, repair, expand or stop a particular deployment, rather than calculate an impressive return from assumed minutes saved.
The unit of analysis should be a business outcome a responsible person can recognise: an accepted supplier comparison, a resolved support request, an approved change or a reconciled record. A model response is an intermediate artefact. If the output must be reviewed, corrected and entered into another system, that work belongs inside the measurement boundary.
Use more than one dimension. Research on developer productivity through the SPACE framework cautions against representing productivity with one activity measure.[1] The same practical concern applies when assessing agent-enabled workflows: greater throughput with worse quality, exhausted reviewers or growing exception queues may not be an improvement worth scaling.
Define the outcome ledger
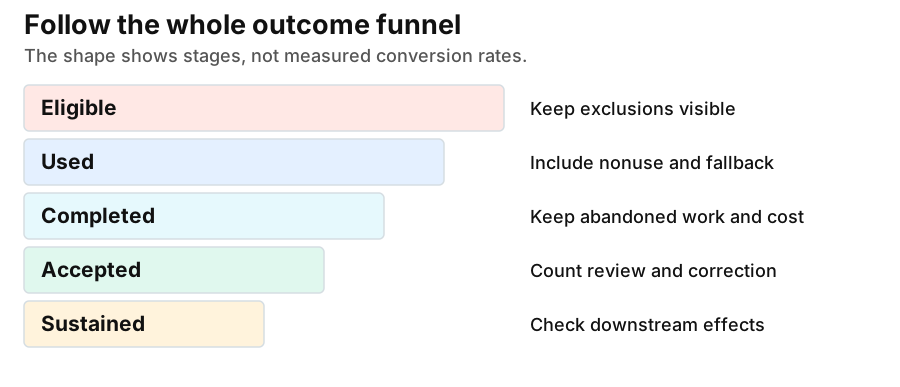
Record the eligible population before measuring adoption. Which tasks may enter the agent-enabled process, and which are excluded? A high completion rate among easy selected cases says little about the full workload. Keep the number and character of excluded cases visible, including the human process used to handle them.
Within the eligible population, distinguish offered, used and completed work. Some users will decline the tool, some tasks will be abandoned and some runs will fall back to a person. Do not remove these cases from the business view merely because they lack a successful final response. Their effort and costs still affect the operating decision.
Define acceptance with the business owner. Acceptance may require accuracy, evidence, policy compliance and a usable final artefact. Track first-pass acceptance separately from acceptance after correction. A system that eventually produces a valid result after substantial rework should not be reported as equivalent to one that produces it correctly the first time.
Continue measurement far enough to observe meaningful downstream effects. A support answer can appear resolved and then reopen. A code change can pass initial review and later cause a defect. Choose a follow-up window appropriate to the process and report when observations are still immature. The absence of a recorded downstream failure is not conclusive when no one has looked for it.
Use stable definitions for the denominator, time window and exclusions. A useful metric statement reads: “accepted comparisons among all eligible requests assigned to the assisted process during the evaluation period, including fallback.” That is more interpretable than “agent success rate,” which can conceal changes in selection, retries or human rescue.
Measure the whole human workload
Break human effort into preparation, interaction, review, correction, exception handling and maintenance. An agent may reduce drafting time while increasing review. It may shift work from a junior operator to a scarce specialist. Both changes matter, and neither is visible in a count of generated outputs.
Observe time where feasible rather than relying only on recollection. Sampling, task logs and structured diaries can complement system events. Explain the limits of each method and minimise personal monitoring. Measure work to improve the process, not to rank employees using an incomplete proxy. A person may reasonably spend more time because the task is harder or the quality standard is higher.
Separate elapsed time from active effort. An unattended run that waits for an approval can have low human effort and long cycle time. A fast run can consume intense expert attention. Buyers and users may value those outcomes differently. Record the distinction before turning either into a monetary estimate.
Account for concurrent work. If one person supervises several agents, summing run durations overstates the person’s time. Conversely, counting only the moments when they type understates attention, context switching and review. Define an observation method that reflects the actual work arrangement and document what it cannot capture.
METR’s February 2026 update explicitly discusses selection effects and difficulties measuring time when developers use multiple agents.[2] This is a reason to examine a measurement design carefully, not a reason to substitute an unsupported productivity multiplier. Better tools can change both the work and the feasibility of the experiment used to evaluate them.
Choose a comparison that can support the claim
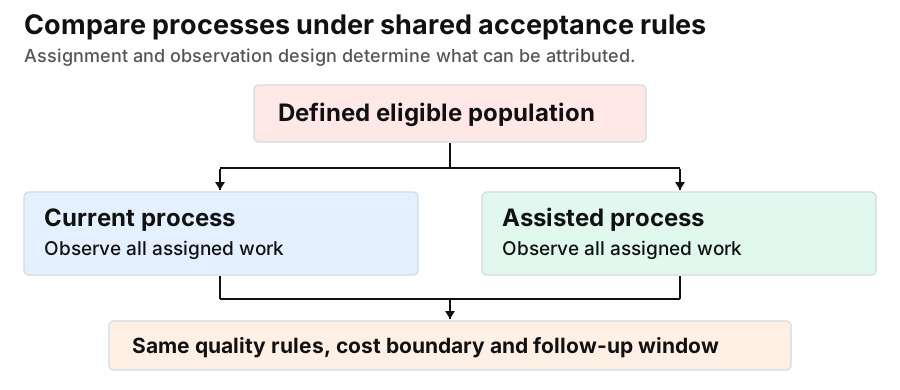
A before-and-after chart is easy to produce and easy to misread. Work may become simpler, seasonal demand may change, a policy may be revised or a team may gain experience. If those changes coincide with agent adoption, the chart does not isolate the agent’s contribution.
Where practical and ethical, randomly assign eligible work to the current and assisted process. Keep acceptance criteria and follow-up comparable. Select a unit of assignment that limits interference: task, worker, team or time block, depending on how people and information move. An experiment at the wrong unit can contaminate the comparison when learning or shared artefacts cross between groups.
When randomization is not feasible, consider matched comparisons, phased rollout or repeated measurements with a credible explanation of external changes. State the assumptions required to interpret the result. HM Treasury’s Magenta Book discusses evaluation design and the need to understand how an intervention produces outcomes.[3] The private-sector application here is a recommendation, not a legal obligation.
Define the primary outcome and decision rule before examining results. Keep secondary measures for diagnosis. If the first selected metric disappoints, changing the headline to a favourable metric can mislead the sponsor. Exploratory findings are useful when labelled and tested again; they should not be presented as confirmation of the original hypothesis.
Record nonparticipation and missing data. Enthusiastic users may choose easier tasks or invest extra time learning the tool. People who expect poor results may avoid it. These patterns affect what can be concluded about a broader rollout. An analysis of active users answers a different question from an analysis of everyone offered the tool.
Interpret external evidence without importing its effect size
Published studies are useful for identifying mechanisms and challenging assumptions. They are not a substitute for a local baseline. A customer-support deployment studied by Brynjolfsson, Li and Raymond found different effects across worker experience levels.[4] That finding suggests examining who benefits and under what conditions; it does not supply a universal rate of return for autonomous agents.
METR’s early-2025 randomized study examined experienced developers working on familiar open-source repositories and reported slower task completion with the tools used in that setting.[5] Its later update warns that selection and measurement problems limit conclusions about newer tools.[2] Treat both as context-specific evidence. Neither proves that AI always helps nor that it always hurts.
Benchmark performance measures another part of the picture. A benchmark may show whether a system can complete specified tasks under controlled conditions. A deployment measure asks whether the combined system of people, tools and work produces a better outcome at acceptable cost. Confusing those questions can lead a sponsor to expect business value from capability evidence alone.
External evidence should change the questions in the local plan. It may suggest separating novice and experienced users, examining review effort, controlling task selection or tracking the cost of learning. It should not be used to fill a financial model with a convenient percentage whose assumptions do not match the organisation.
Translate operational change into financial meaning
Start with an explicit cost boundary. Include model and tool usage, infrastructure, licences, integration, evaluation, security and privacy work, human review, incident response, maintenance and relevant change management. Separate one-time implementation cost from recurring operating cost. Allocate shared costs consistently and make the allocation rule visible.
For a bounded process, compare cost per accepted outcome at a comparable quality level. The numerator includes failed attempts and fallback work; the denominator includes accepted outcomes under the stated criteria. Also report total cost and volume, because a lower unit cost can coexist with higher total expenditure if demand expands.
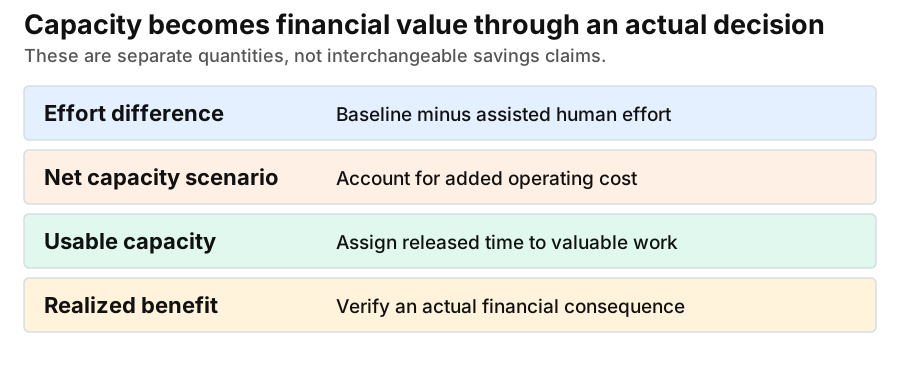
Keep three benefit categories separate. Released capacity is time available for other work. Avoided expenditure is a cost that would otherwise have occurred under a credible plan. Realized financial benefit is an observed change in expenditure or contribution that can be reconciled to business records. Moving between these categories requires evidence of what management actually did.
Do not count the same benefit twice. If saved hours allow more cases to be processed, valuing both the hours and the entire revenue from extra cases can duplicate the contribution. Use a finance-reviewed mechanism: for example, capacity enables additional accepted volume, which produces incremental contribution after the associated cost. Keep nonfinancial benefits visible when they matter, without forcing them into speculative currency values.
Risk reduction is particularly difficult to monetize when events are rare and baseline probabilities are unknown. Record the control improvement and evidence directly. If a financial scenario is useful, show assumptions and ranges, and avoid describing a modelled avoided loss as a realized saving. NIST’s AI RMF emphasizes context and the management of impacts; a risk framework does not validate an ROI calculation.[6]
Illustrative calculation: comparison preparation
Consider a fictional purchasing team evaluating an assistant that prepares supplier comparisons. All quantities below are constructed solely to demonstrate arithmetic. They are not observations from Softlander or another organisation and are not a forecast for a prospective engagement.
Suppose the current process accepts 100 comparisons in a period. Each accepted comparison requires an average of 40 minutes of total human effort, including correction. The hypothetical baseline therefore uses 4,000 minutes. For a comparable set of 100 accepted comparisons, the assisted process requires 22 minutes of preparation and review plus 8 minutes of correction and exception effort per accepted comparison, or 3,000 minutes in total.
The observed quantity in a real study would be the difference in total effort under comparable conditions. In this constructed arithmetic, the difference is 1,000 minutes, or approximately 16.7 hours. It is released capacity. It is not automatically a reduction in payroll, because the team may remain the same size and use the time for other work.
Now suppose the assisted process adds 500 currency units of recurring platform and usage cost during the period. A hypothetical fully loaded labor rate of 60 currency units per hour values the 16.7 hours at approximately 1,000 units. The notional capacity value after the added recurring cost is approximately 500 units, before implementation, maintenance and other omitted costs. This is an analytical scenario, not a cash saving.
The sponsor should then ask what changes the conclusion. If correction effort rises, if the accepted quality differs, if the task mix becomes harder or if the additional capacity cannot be used, the apparent advantage may shrink or disappear. If the assistant enables a valuable service improvement, that benefit needs its own evidence rather than being silently included in the time calculation.
The example deliberately uses a generic currency unit because no commercial price or jurisdictional accounting treatment is being proposed. A real evaluation should use one explicit currency, a documented labor-cost basis, an agreed cost boundary and a sensitivity analysis. Finance should review the interpretation before the result supports an investment commitment.
Protect quality and people while pursuing value
Choose guardrails that can stop expansion even when the primary outcome improves. Examples include serious policy breaches, unauthorised actions, unacceptable rework, worsening customer experience or an unsustainable review burden. Define who can invoke the stop and how work returns to an acceptable fallback process.
Examine distribution, not only averages. A process can improve overall while disadvantaging a language group, less experienced users or complex cases. Select relevant segments based on the workflow and affected people, subject to lawful and proportionate data use. Avoid collecting sensitive attributes without a justified purpose and appropriate oversight.
Observe learning over time. Initial use may include training costs, novelty effects and temporary support. Later operation may reveal maintenance or complacency. Decide whether the investment question concerns early adoption, steady-state operation or both, and collect enough evidence to distinguish them. Do not exclude training effort merely because it makes the first period look worse.
NIST’s Generative AI Profile discusses risks that can accompany generative AI deployment beyond immediate task performance.[7] For an impact evaluation, this supports keeping relevant harms and operational constraints alongside the value measures. A favourable financial scenario should not conceal an unresolved data or authority problem.
A measurement plan the sponsor can approve
Before rollout, write a short plan that fixes the question, population, comparison, measures and decision rule. Assign owners for data quality, analysis, operational response and financial interpretation. If no one can maintain the measures after the pilot, reduce the plan to a sustainable core rather than promise a dashboard that will become stale.
Practical worksheet
| Item | Decision to record |
|---|---|
| Outcome | What accepted business result is counted? |
| Population | Which work is eligible, excluded or assigned to fallback? |
| Comparison | What would happen without the intervention? |
| Quality | Which acceptance criteria and follow-up checks apply? |
| Effort | How are review, rework, exceptions and maintenance measured? |
| Cost | Which one-time and recurring costs are included? |
| Attribution | Which alternative explanations or selection effects remain? |
| Threshold | What leads to expansion, repair, continued observation or stop? |
| Finance | Is the benefit capacity, avoided cost or realized contribution? |
Keep a metric dictionary with units, event definitions, data source, owner and revision date. A change from “all assigned cases” to “completed runs” changes the meaning of the result even when the dashboard label stays the same. Version the definition and explain the break in comparability.
Audit a small sample of the underlying records. Trace an accepted outcome back through the run, human review and downstream follow-up. Check whether costs and abandoned work are included. A precise chart built on incomplete events is less useful than a modest estimate with an honest account of missing data.
For proportions and sampled measures, use uncertainty estimates appropriate to the design. NIST’s handbook provides methods for proportion intervals.[8] The analytical method must also account for relevant clustering and dependence. Hundreds of tasks performed by a handful of people do not necessarily provide hundreds of independent observations about workforce-wide impact.
Give every claimed benefit an operating owner
A measurement team can identify released capacity without being able to realize it. The business owner must decide what happens to that capacity: reduce a backlog, improve service, avoid a planned purchase or assign people to different work. Record that decision and follow the consequence. Otherwise the same notional saving may appear in repeated reports while nothing changes in the operation.
Use a benefits register with one row per mechanism. Each row should identify the baseline, expected change, evidence source, owner, timing and costs required to sustain it. Keep an expected benefit separate from an observed one. If an assumption changes, retain the prior assumption and explain why the estimate moved rather than silently replacing the original business case.
For service improvement, identify the recipient and observable effect. Faster first response may be valuable, but a customer may care more about complete resolution or avoiding another contact. If the chosen measure is only a proxy for the desired experience, test that relationship through appropriate feedback and downstream observation. Do not assume that a faster internal step necessarily improves the user’s journey.
For additional capacity, ask whether demand exists and whether another bottleneck prevents its use. A team may prepare more comparisons while managers remain unable to review them. Expanding agent throughput in that situation can increase work in progress rather than accepted output. Measure the whole queue and consider whether review, policy clarification or integration repair is the better next investment.
For avoided expenditure, document the credible counterfactual. A hiring request that was never approved is different from an approved role that is no longer needed. A forecast reduction in vendor cost is different from a signed reduction in the contract. Finance can help determine what language is justified without discarding useful operational evidence that has not yet become a cash effect.
Set a review point after the initial evaluation. Ask whether the quality level persists, maintenance effort has changed and the intended use of capacity actually occurred. Benefits can decay as source data, policies and user behaviour change. Continuing to fund a deployment should rest on current evidence and an accountable operating decision, not indefinitely on a successful pilot period.
Decide what to do with the evidence
Expansion is justified when the evidence supports the intended outcome, guardrails remain acceptable and the operating model can sustain the result. Repair is appropriate when a specific bottleneck explains weak value and has a testable treatment. Continued observation may be necessary when downstream outcomes have not matured. Stopping is reasonable when the alternative is better or the value mechanism remains unconvincing.
Present the result with the decision it supports. Show the population and period, accepted outcome change, human effort, recurring and implementation cost, material harms, uncertainty and remaining assumptions. Keep the recommendation distinct from the observations. A sponsor can then decide whether the next commitment is proportionate to what is known.
Start with one workflow and a defensible baseline. Bring its acceptance criteria, current operating data and the investment decision to a discussion with Softlander. An impact-measurement engagement should clarify the method and evidence required; it should not promise a return before the work has been measured.
References
[1] Forsgren and colleagues. The SPACE of Developer Productivity: There’s more to it than you think. ACM Queue, February 2021. Multidimensional productivity framework.
[2] METR. We are Changing our Developer Productivity Experiment Design. 24 February 2026. Selection and measurement constraints in follow-up research.
[3] HM Treasury. Magenta Book: Central Government guidance on evaluation. Current edition accessed 16 September 2026. Evaluation design and interpretation guidance.
[4] Brynjolfsson, Li and Raymond. Generative AI at Work. NBER Working Paper 31161, April 2023, revised November 2023. Deployment-specific evidence on a conversational assistant.
[5] METR. Measuring the Impact of Early-2025 AI on Experienced Open-Source Developer Productivity. 10 July 2025. A defined randomized study, not a universal productivity estimate.
[6] NIST. Artificial Intelligence Risk Management Framework, version 1.0. January 2023. Voluntary contextual risk-management framework.
[7] NIST. Artificial Intelligence Risk Management Framework: Generative Artificial Intelligence Profile. July 2024. Generative AI risk guidance.
[8] NIST/SEMATECH. Confidence intervals for proportions. e-Handbook of Statistical Methods, section 7.2.4.1; accessed 16 September 2026.